

BrightLocal published the sixteenth Local Consumer Review Survey on 11 February 2026: 1,002 US adults on a SurveyMonkey panel, nineteen charts, and a set of headline numbers that will be quoted in pitch decks all year. We opened every chart and read it against the text written around it.
Most of the findings hold. Six do not match the prose that describes them, and the loudest one of all, the arrival of AI, compares two different questionnaires. This is a reading of the data for a small business in Europe, a market the survey does not cover at all.
What the survey measured, and whose market it describes
This is a self-reported online panel: 1,002 adults in the United States, set against 1,026 the year before. It records what people say they do about reviews, not what anyone watched them do, and it contains no respondents from Poland, Ukraine or anywhere else in the European Union.
The age quotas are even, at 22% aged 18 to 29, 25% aged 30 to 44, 28% aged 45 to 59 and 25% aged 60 or over. That balance is worth knowing, because review habits differ sharply by age and a skewed panel would show up here first.
The sample size is not the weak point here; self-report is. Research on the intention-behavior gap keeps finding that stated intentions predict observed conduct far more weakly than they predict what people report about themselves. Read a line like “31% will only use a business rated 4.5 or above” as a stated rule, not a measured threshold.
BrightLocal sells reputation software. That does not make the data wrong, and the methodology is published openly, which is more than most vendor research offers. It does mean the framing leans towards “reviews matter more than ever”.
Almost everyone reads reviews, but the list of places got longer
Ninety-seven percent read reviews for local businesses and the average person consults six different sites. Google leads every platform by a wide margin at 71%, though that sits twelve points below last year, while Facebook, Yelp, YouTube, Apple Maps and a row of directories all gained ground.
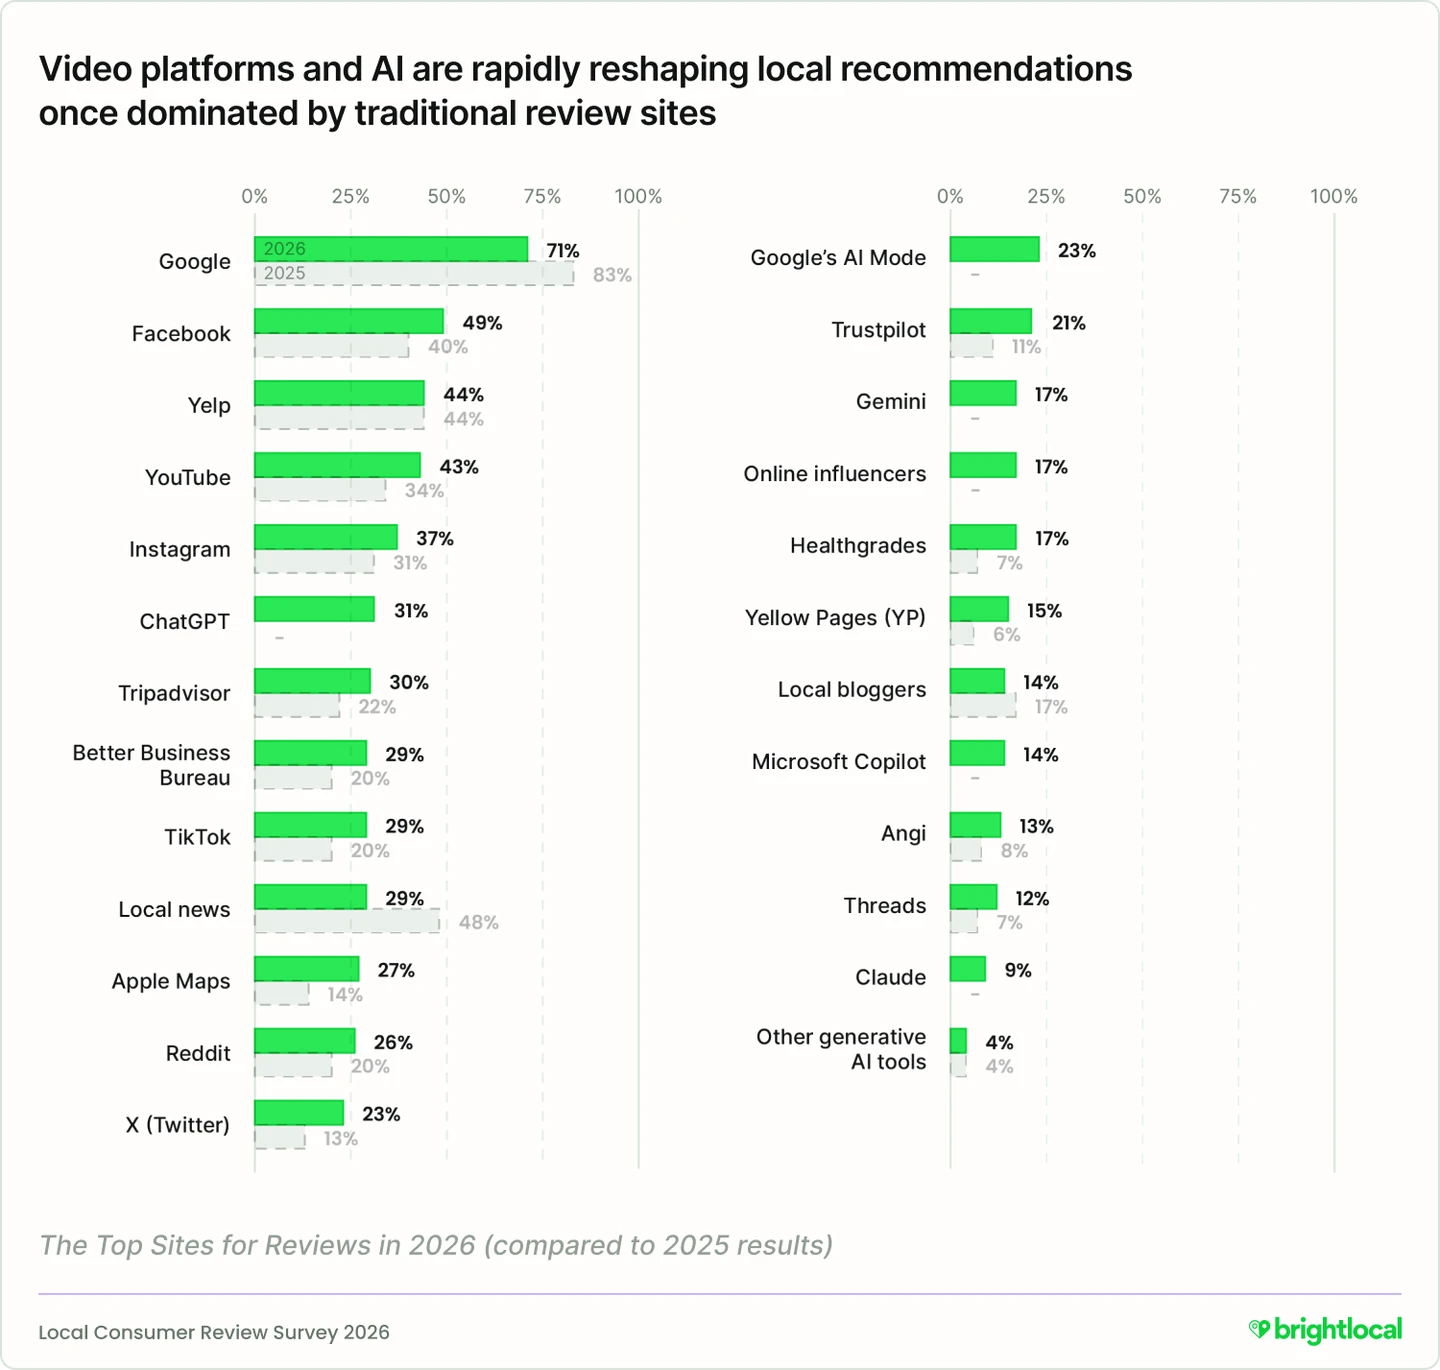
Facebook reaches 49%, Yelp 44% and YouTube 43%. Apple Maps almost doubled to 27%, Trustpilot rose to 21%, and Healthgrades and Yellow Pages more than doubled off small bases. Attention is spreading over more platforms rather than moving from one to the next.
The exception is local news sites, down from 48% to 29%. BrightLocal attributes Google’s own slide partly to supply: its SMB Marketing Report 2025 found only 35% of small businesses have a Business Profile at all, so a large share of searches meet no Google reviews to read.
The 45% AI figure is a net across six tools, not one habit
The most quoted number in the report, a leap from 6% to 45% for generative AI, is an aggregate. The platform chart lists five named AI tools with no 2025 bar whatsoever, meaning they were not offered as answer options that year. Taken alone, the biggest of them reaches 31%.
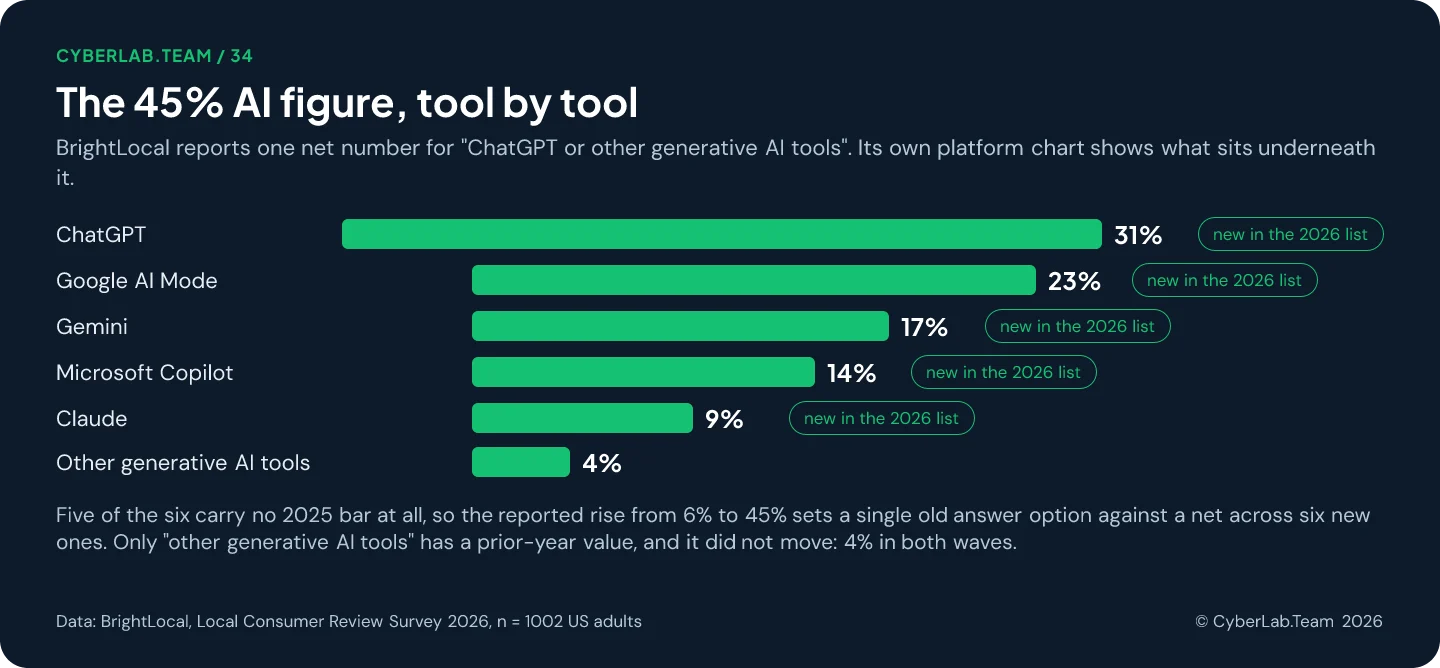
That does not make AI irrelevant to local discovery. It means the honest version of the claim is narrower: roughly three in ten say they have used ChatGPT for a local recommendation, and the combined reach of all six tools is 45%, measured for the first time this year.
Trust is a plurality rather than a majority. Forty percent agree they trust AI for local business recommendations while 32% disagree and 28% sit in the middle. Asked whether they trust AI as much as online reviews, 42% agree and 33% disagree.
Review summaries are the quieter story. Eighty-two percent read the AI-generated summary above a set of reviews, and 23% would decide on that summary alone. Google now generates these in Maps with Gemini, which makes the aggregate impression of your reviews, not any single review, the thing a customer reads first.
The star bar rose, and the chart behind it does not fully add up
Thirty-one percent say they will only use a business rated 4.5 or better, up from seventeen. That particular move is large and clean. The cumulative figure built on top of it is not: the same chart’s 2025 bars add up to 50%, while the report quotes 55% for the identical measure.
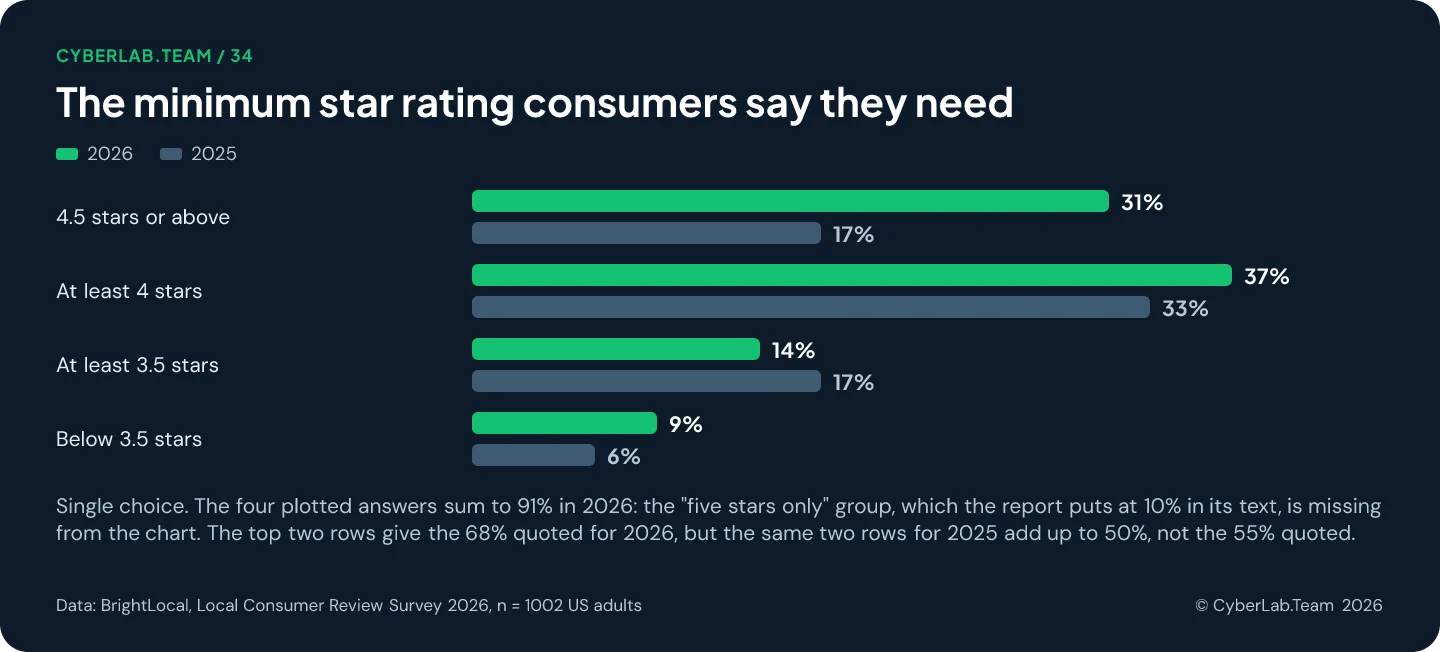
There is a second gap. The text says 10% will only consider a five-star business, but no five-star row appears on the chart, which is why the plotted answers stop at 91%. The 68% headline for “four stars or more” therefore excludes the strictest group of all.
Volume matters alongside the average. Forty-seven percent will not use a business with fewer than twenty reviews and only 9% are comfortable with five or fewer. That second figure is the one that bites a new business or a new location.
The recency window moved from months to weeks
Consumers pulled their definition of a current review inwards. Asked how recently a review must have been left to affect their decision, more people chose the past week and the past fortnight than a year ago, while every window from one month outwards lost share.
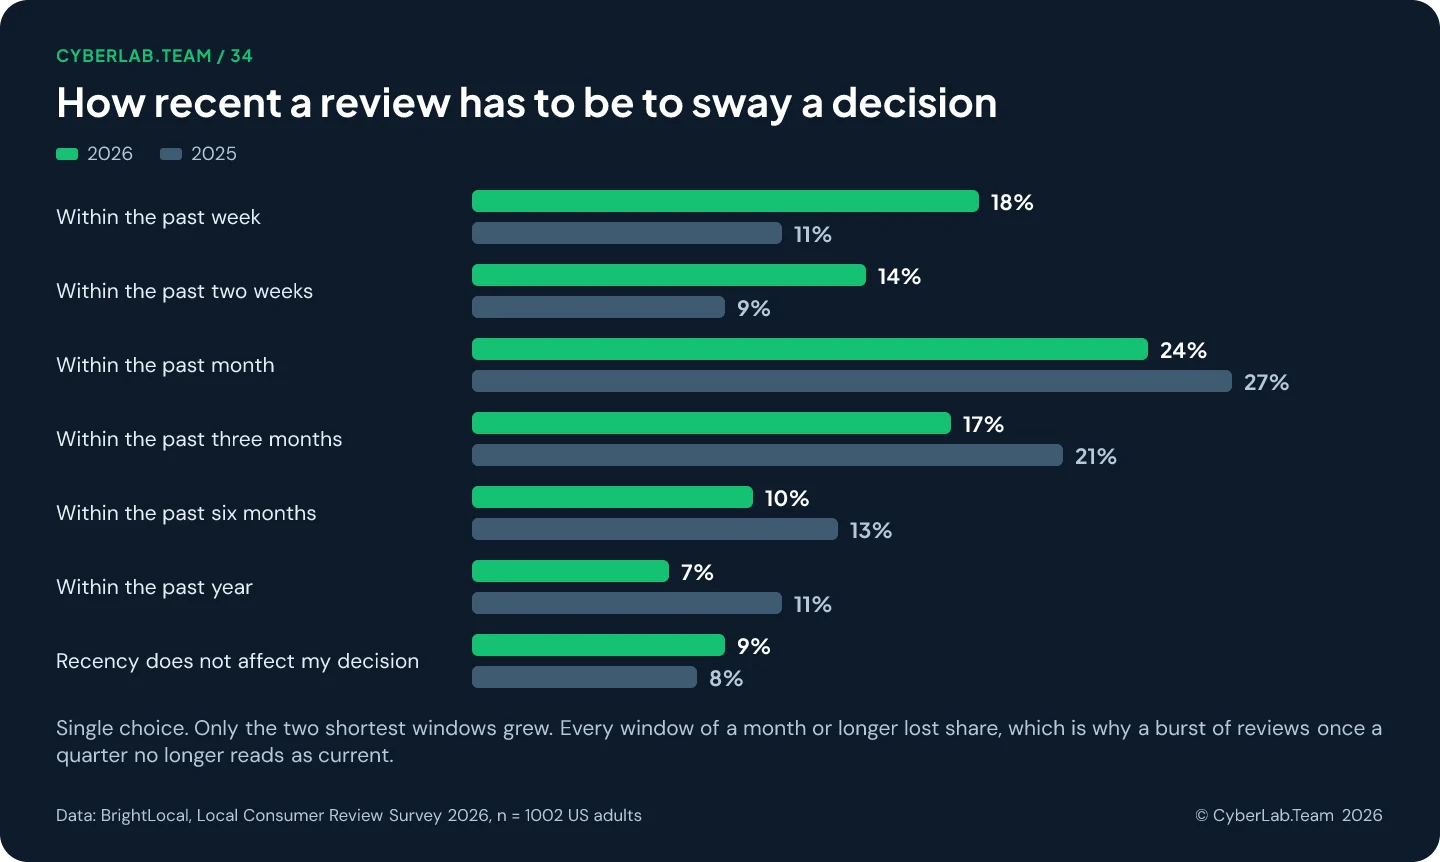
Adding the two shortest answers gives 32% who want something from the last fortnight, against 20% last year. That is the finding with an operational consequence: a quarterly push that lands thirty reviews in a fortnight and nothing for ten weeks now reads as stale for most of the quarter.
Fewer people are writing reviews, especially critical ones
The supply side moved the other way. Sixty-nine percent left a review over the past twelve months, yet the share writing up a bad experience dropped six points and the group who say they never would has edged upward. Businesses now want more reviews from a population writing fewer of them.
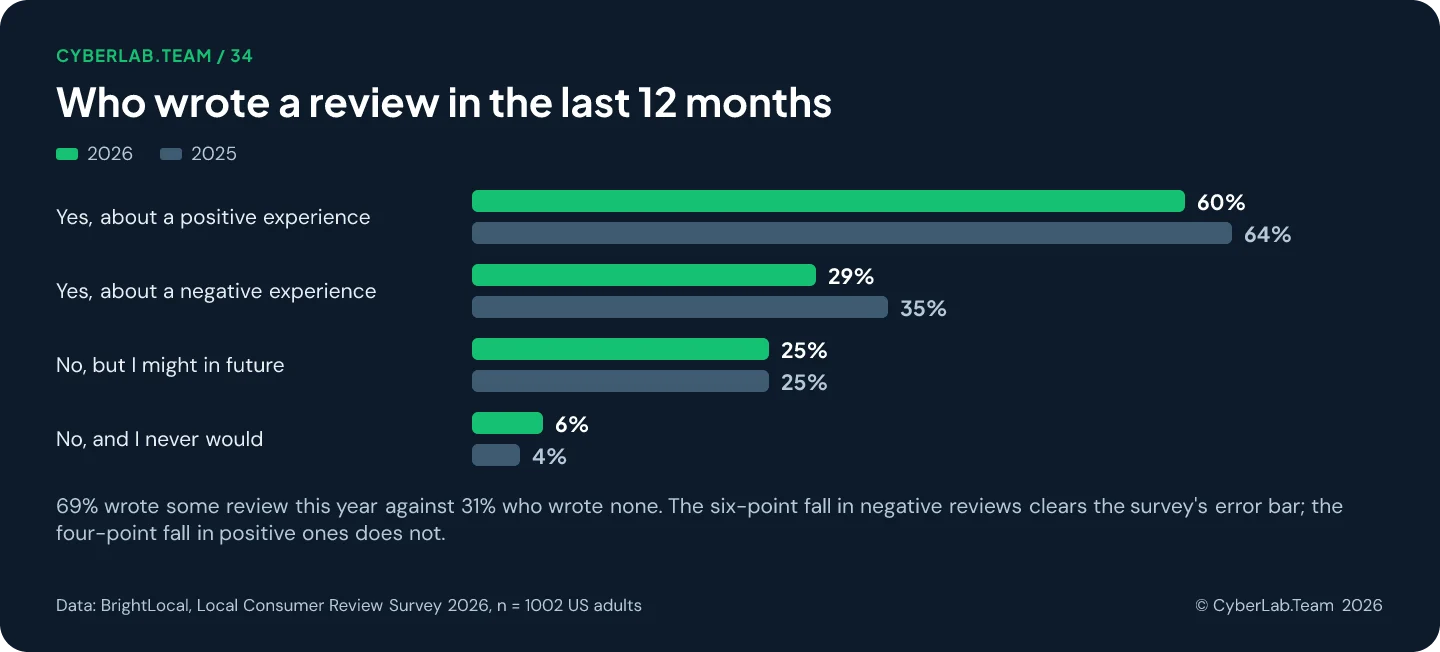
Most reviewers are occasional: 75% wrote between one and ten reviews over the year. Here the write-up and the chart part company again, because the text claims 20% wrote more than ten while the plotted buckets add to 26%, and it puts the heaviest reviewers at 7% where the chart gives 10%.
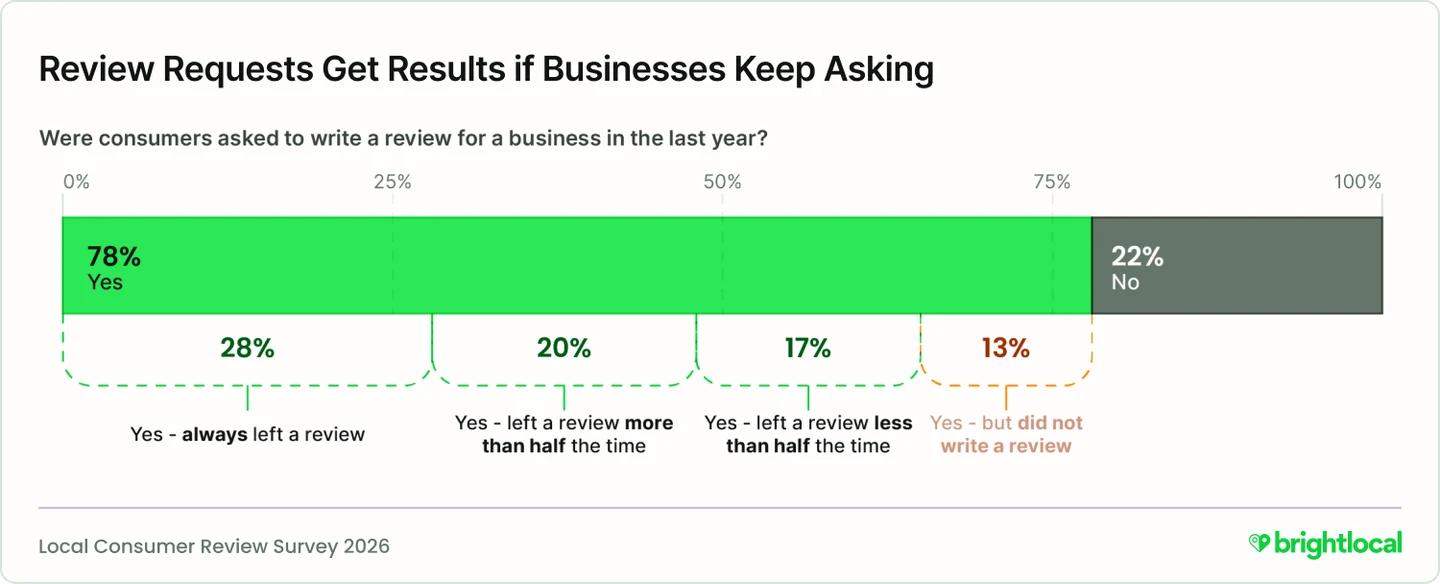
Asking still works, and one pair of numbers in the report looks contradictory until you check the denominators. Seventy-eight percent were asked for a review; 65% of everyone surveyed wrote one after being asked, which is 83% of the people who were actually asked.
Same-day replies tripled, and so did indifference
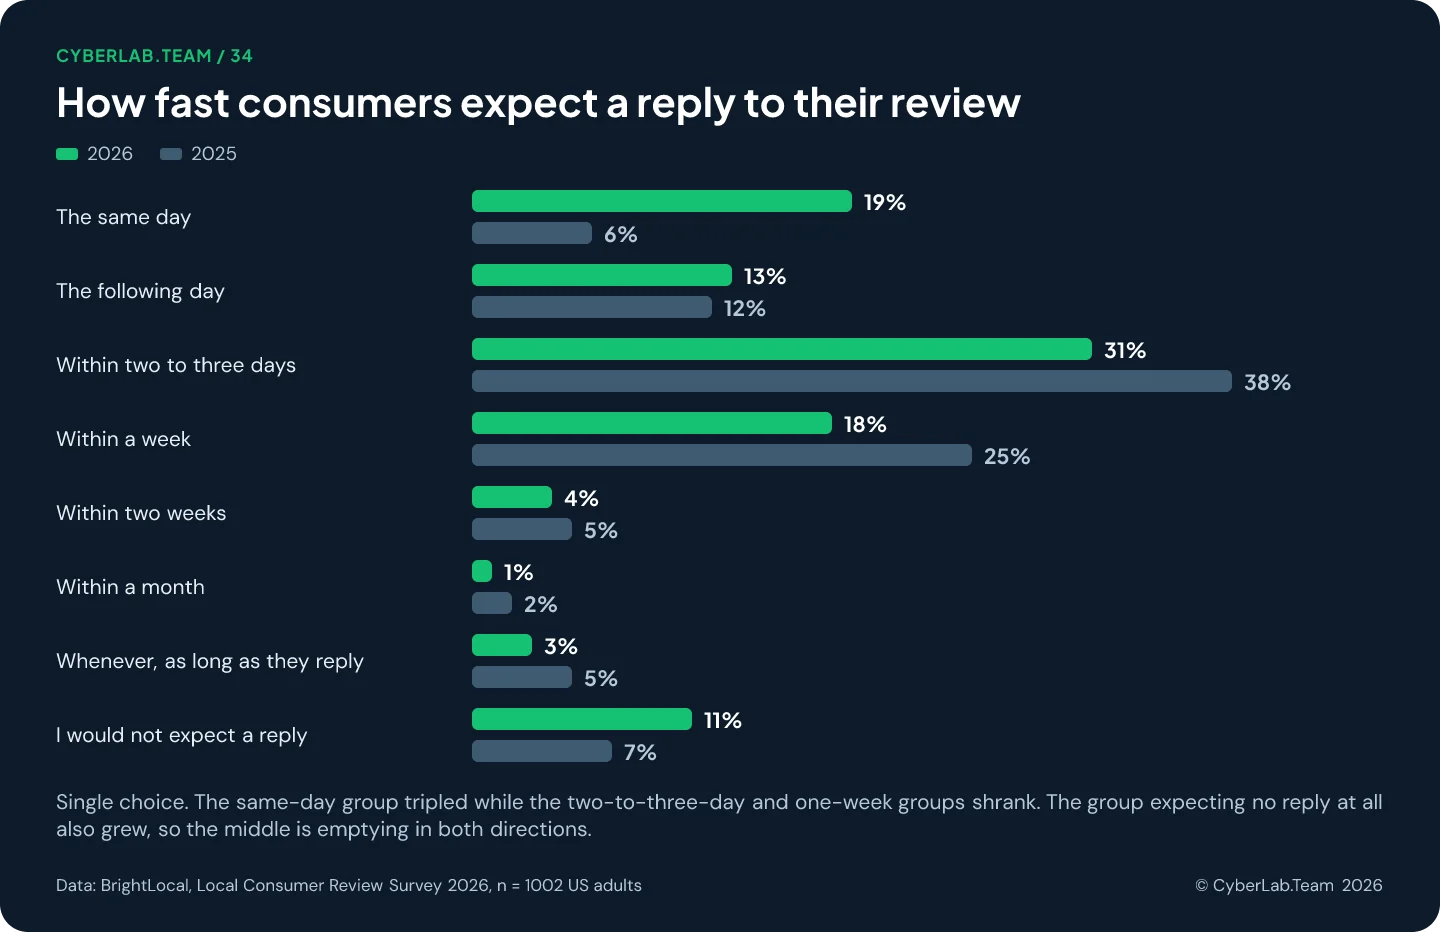
Nineteen percent now want an answer on the day they post, against six a year ago. The tidy reading is that everyone grew impatient. The chart shows something less tidy: the two-to-three-day and within-a-week groups both shrank, and the group expecting no answer whatsoever grew as well.
Eighty-nine percent expect a reply of some kind, and 81% want it inside a week. What the response chart adds is that replying selectively barely helps: answering only positive reviews scores 45% and only negative ones 47%, against 80% for answering everything.
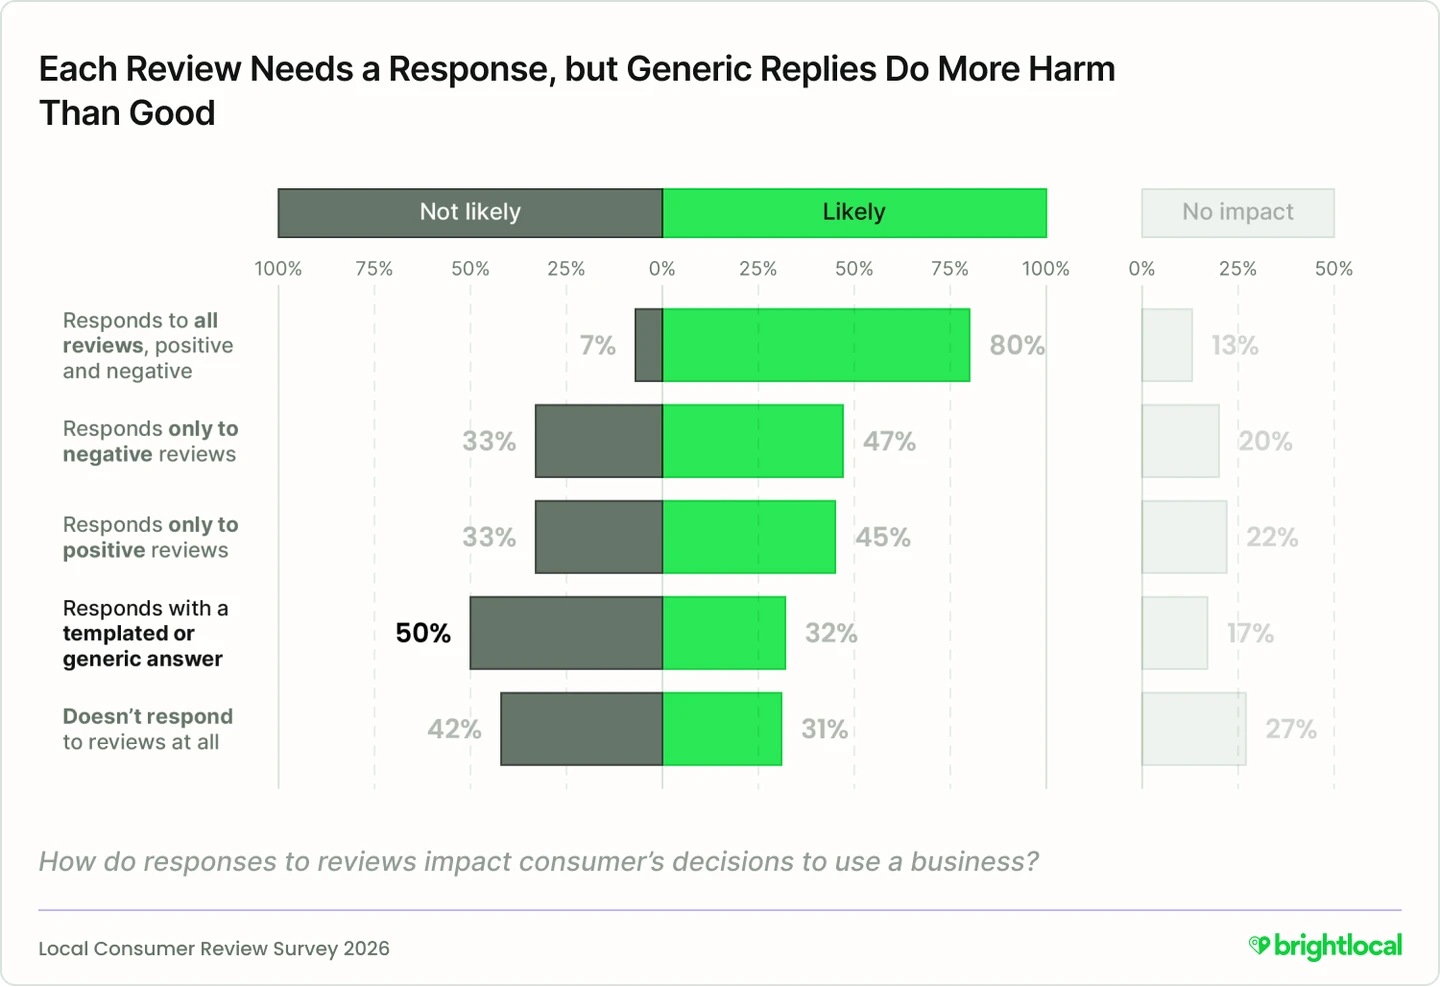
A generic answer makes 50% unlikely to use the business, while silence makes 42% unlikely, so a copy-pasted thank you tests worse than saying nothing. And 31% remain likely to use a business that never replies at all.
After a good review, most people go looking for your website
A positive review rarely closes anything by itself. Two thirds of readers carry on researching and a third move towards a purchase. The most common next step is opening the company’s own site, picked by 54%, up from 32% when the question was last put in 2019.
Beyond the website, 37% read more reviews on the same platform, another 37% go to a different platform, and 24% check social channels. Meanwhile 22% simply keep looking at other businesses, the cost of a weak next step.
That is where the funnel breaks for small firms. BrightLocal’s own small-business research puts the share of small businesses with a dedicated website at 40%, so for a majority the most popular action after a good review leads nowhere useful.
The chart’s purchase column is labeled “visit the business’s website” at 31%, while the surrounding text calls the same figure visiting the business location. One of the two is a slip, so we would not build a plan on that number.
Ninety-three percent have bought something after reading a positive review, 27% have spent over $1,000 and 13% over $5,000. Seventy percent have also regretted a purchase made after reading reviews.
What consumers want done about fake reviews, and what the law already does
Consumers put the burden on platforms first: 65% say review sites should catch fakes and 49% say the business receiving them should. The punishments they favor run from a platform ban all the way to prison. Regulators, meanwhile, have already acted, and in Europe further than these respondents assume.
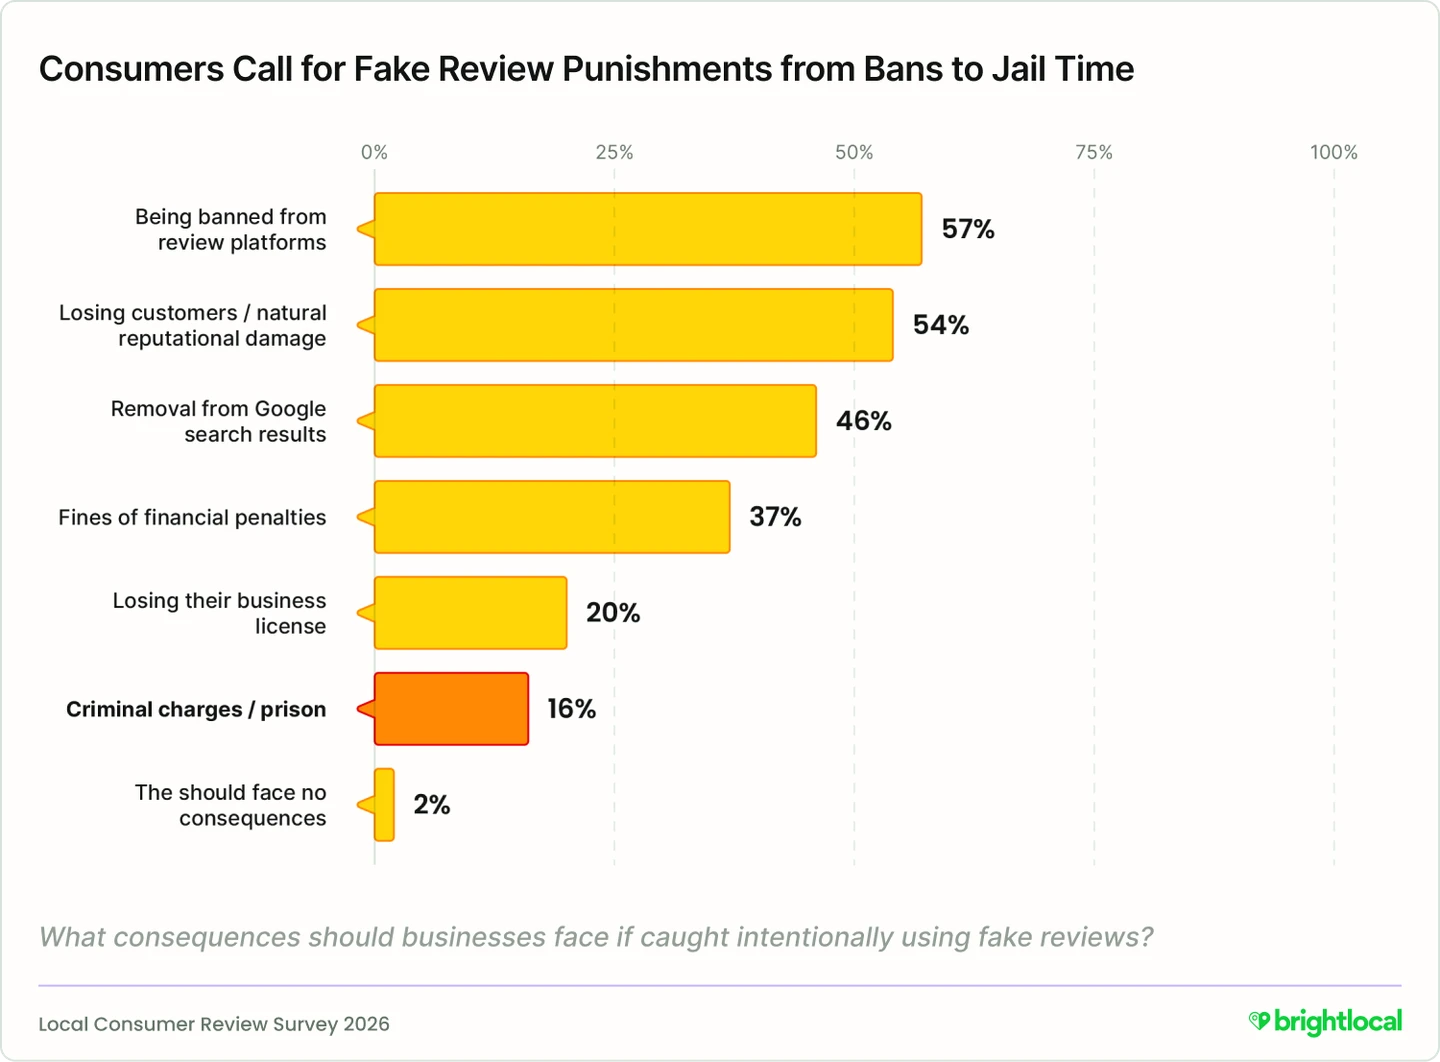
There are two more discrepancies here. The text gives 63% for platform responsibility where the chart shows 65%, and it says 3% want no consequences, which would make the headline 97%; the chart shows 2%, so the correct headline is 98%.
For a European business the legal position is stricter than platform policy, and it is what actually governs the practices this survey describes.
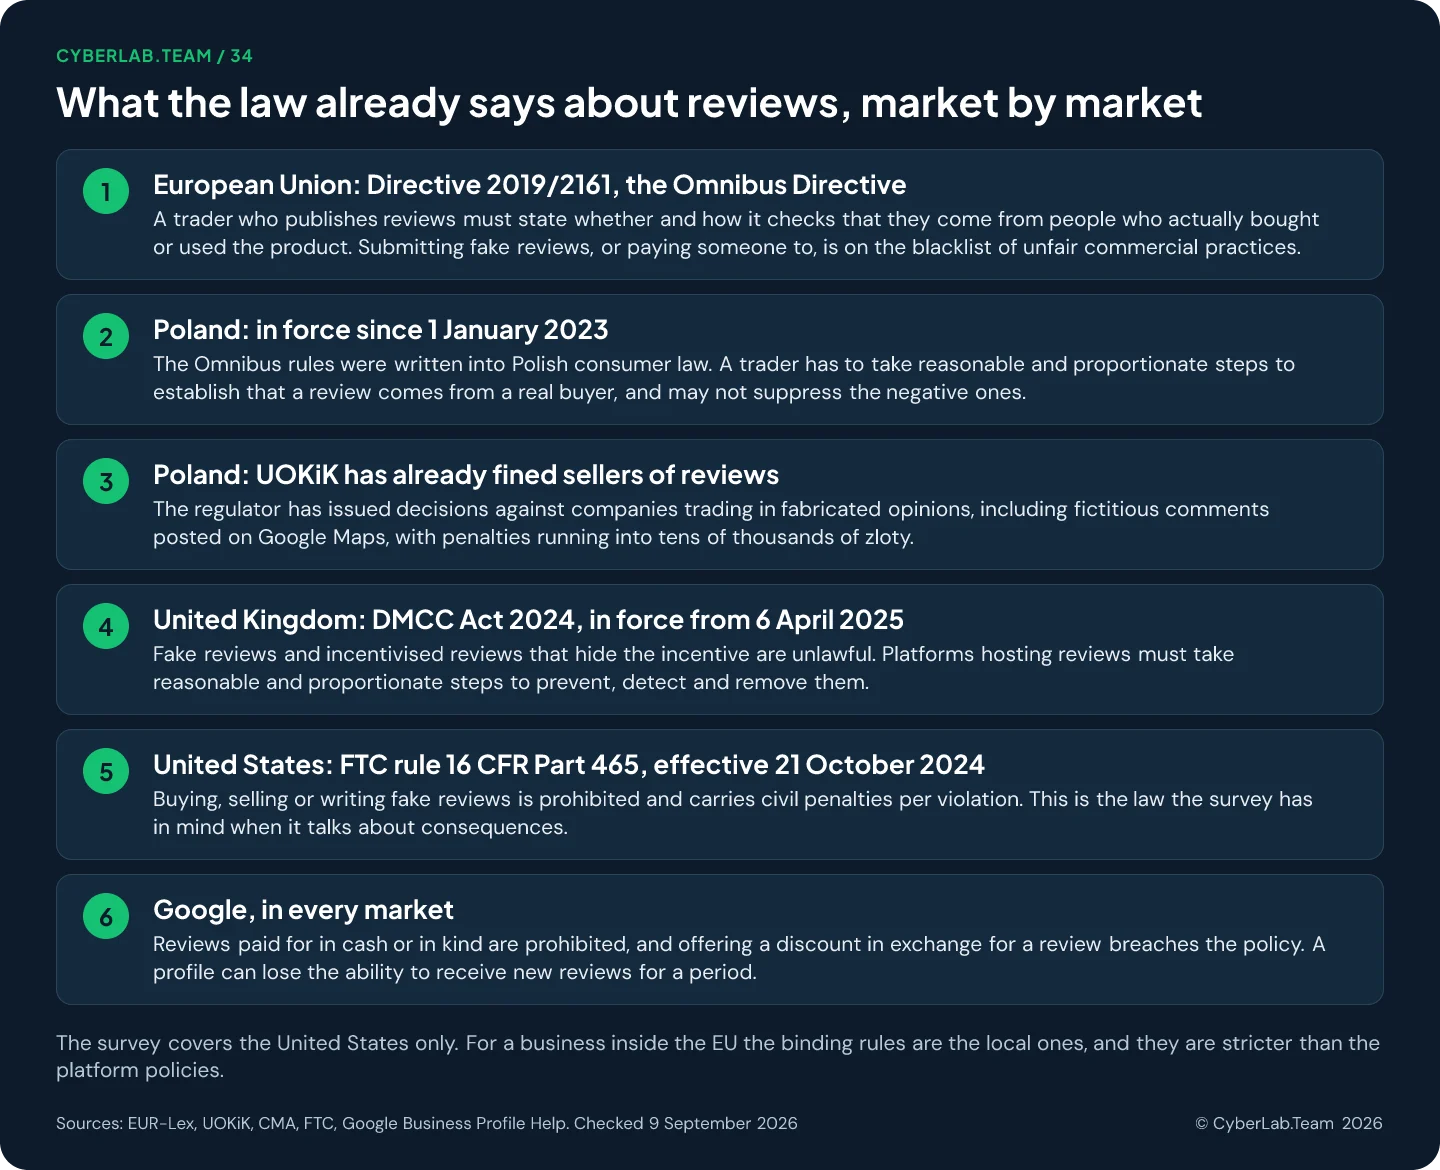
Enforcement is not theoretical: the European Commission’s coordinated sweep of 223 sites found at least 55% potentially in breach of EU consumer law, with 144 unable to demonstrate that they check review authenticity. In Poland, UOKiK has issued decisions against companies trading in fabricated opinions, including fake comments posted to Google Maps.
Platforms remove at scale too. Google blocked or removed over 240 million policy-violating reviews in 2024, along with 12 million fake Business Profiles, while Trustpilot removed 4.5 million fake reviews, 7.4% of everything submitted to it that year.
Only the discount fell out of review incentives
Incentives did not go away, they narrowed. The share offered a discount in exchange for a review dropped nine points to 27%, but loyalty points rose slightly, gifts held, and cash offers stayed flat at 20%. Eleven percent were offered something specifically for leaving positive feedback.
The share offered nothing at all moved from 36% to 41%, so the practice is receding slowly rather than collapsing. The steady 20% for cash is the awkward one, because Google prohibits reviews paid for in cash or in kind and can stop a profile receiving new reviews.
In the EU the exposure is larger than a policy strike. Paying for a positive review, or commissioning reviews at all, falls under the blacklist of unfair commercial practices, where national penalties reach up to 10% of turnover.
Which year-on-year moves are large enough to trust
A poll of a thousand people carries an error bar, and comparing two such polls carries a wider one. At these sample sizes a gap between the two waves needs to reach roughly 4.4 points before it can be separated from sampling noise. Several of this year’s talking points do not get there.
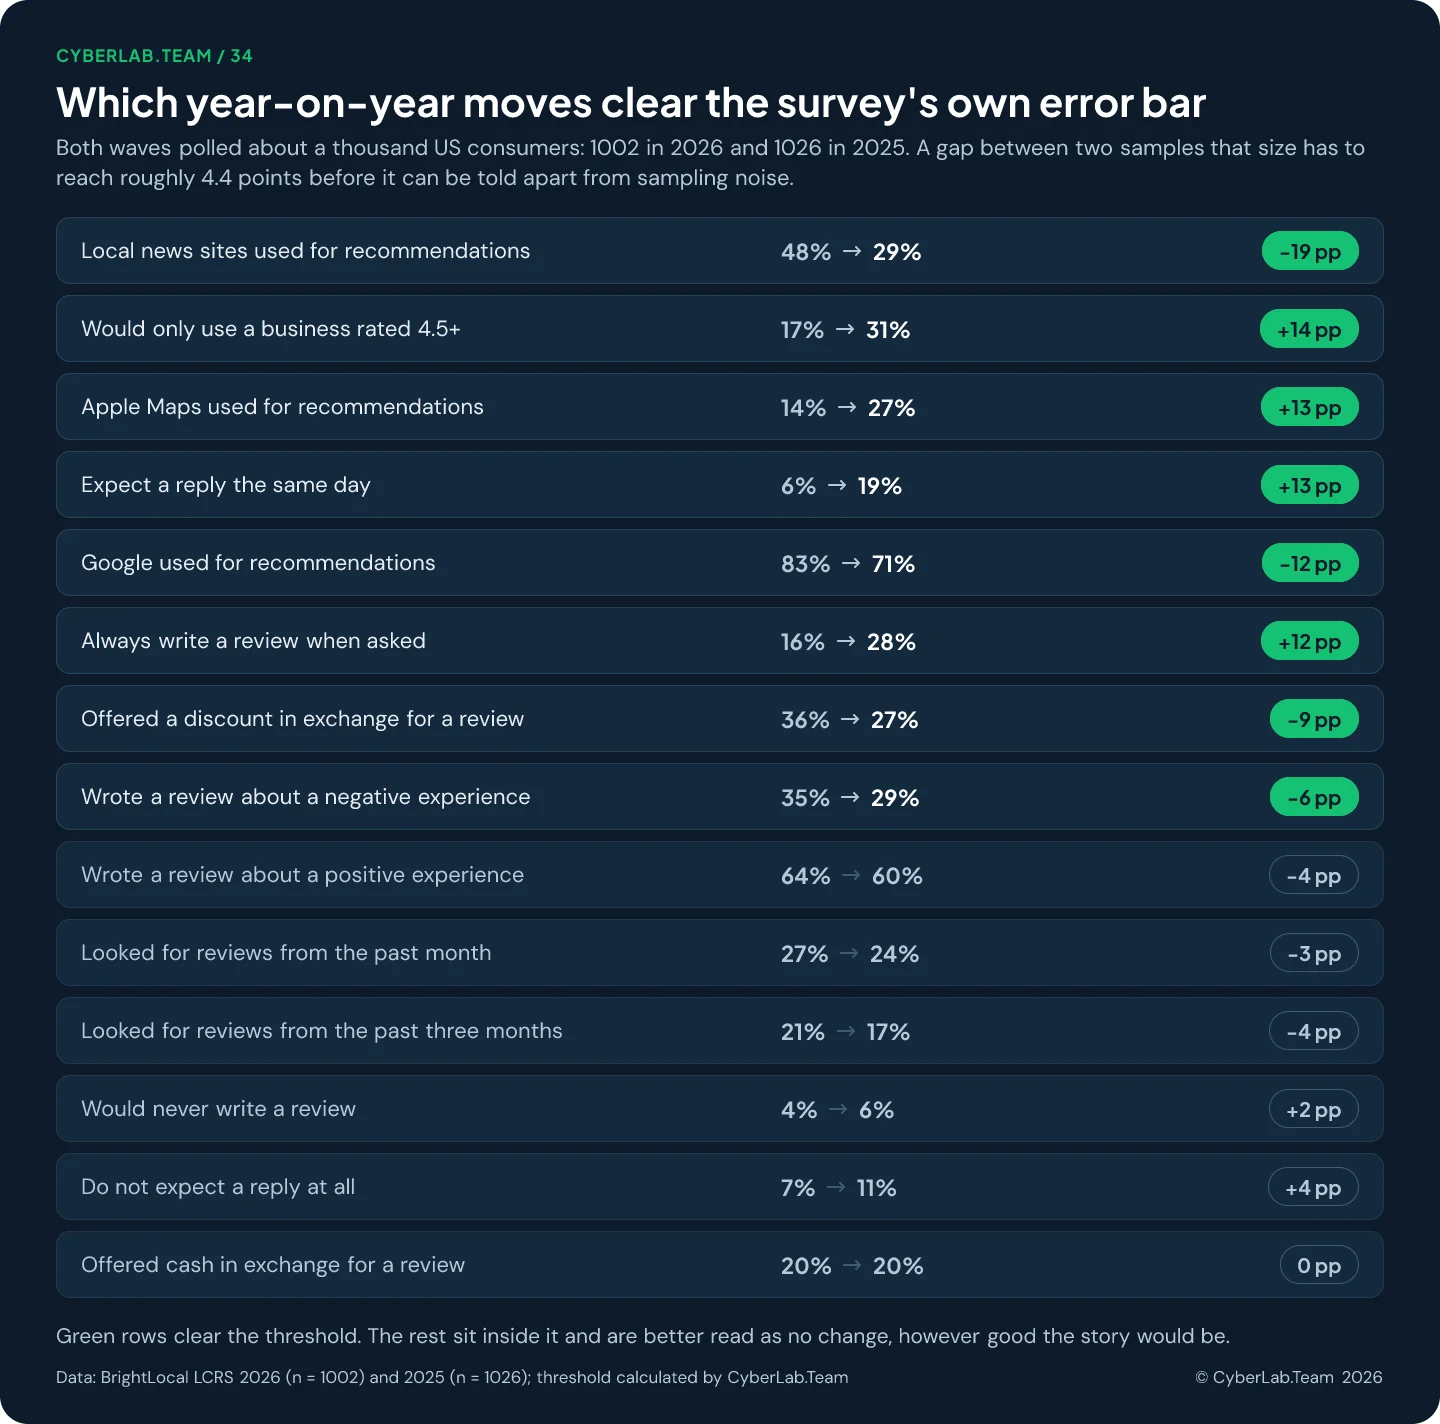
Comfortably above the line: local news at nineteen points, the 4.5-star requirement at fourteen, Apple Maps and same-day replies at thirteen each, Google at twelve, and the willingness to write when asked, also twelve.
Below it, and better described as unchanged: the fall in reviews sought from the past month, the drift in the three-month window, the rise in people who would never write a review, and the four-point dip in positive reviews written. The last of those is the one most likely to be over-read, our own earlier point about shrinking supply included.
What this changes for a small business in the EU
Very little transfers directly, because the survey measures American consumers living under American law. The direction does transfer: a steady flow of recent reviews beats a stockpile, replies need to be quick and specific rather than templated, and whatever sits behind the review has to work when someone arrives.
Keep invitations continuous instead of seasonal, so the newest review is always days rather than months old. Reply to everything within a day, in your own words, and rotate wording rather than pasting one formula. Make sure the website, opening hours and contact route survive the visit that 54% will make. And treat cash, discounts and any request for a specifically positive review as off limits, since in the EU that is not a policy question but a legal one.
For the operational side of all this, our guide to running Google reviews covers requests, replies and problem cases; the profile checklist covers the fields customers rely on, and the Google Maps SEO guide covers where reviews sit among ranking signals.
None of the above was measured in Europe. If your market is Poland, Ukraine or anywhere else in the EU, this survey is a hypothesis to test against your own review data, not a set of benchmarks to adopt.
Sources
- BrightLocal, Local Consumer Review Survey 2026 (11 February 2026), the 19 charts and the methodology
- BrightLocal, Local Consumer Review Survey 2025, the comparison wave, n = 1,026
- BrightLocal, SMB Marketing Report 2025, 35% of small businesses with a Business Profile, 40% with a website
- Google Business Profile Help, improve your local ranking
- Google Business Profile Help, prohibited and restricted content
- Google, Maps uses AI to fight fake Business Profiles
- Google for Developers, AI-powered review summaries
- Trustpilot Trust Report 2025
- Directive (EU) 2019/2161, the Omnibus Directive
- European Commission, sweep of 223 sites for misleading reviews
- UOKiK, decisions on fake online reviews
- PARP, the Omnibus Directive and new obligations for traders
- Cooley, the UK consumer law regime in force from 6 April 2025
- FTC, the Consumer Reviews and Testimonials Rule, questions and answers
- Federal Register, 16 CFR Part 465, final rule
- Frontiers in Psychology, understanding the intention-behaviour gap